The growth in U.S. margin borrowing raises a practical question for investors and lenders: can they withstand a correction without being forced to sell into it? Our central argument is that borrowing should be judged against the cash and collateral available under stress. A larger loan balance creates greater dollar exposure, but its danger depends on whether many investors must raise cash at the same time.
The borrowing has grown
FINRA reports $1.454 trillion in customer securities margin debt for August 2026. Our accompanying analysis compares that with $510.157 billion in August 2016: an increase of approximately 185%, or 11% compounded annually. This is borrowing reported by FINRA member firms, rather than debt allocated to particular stock indexes. [1, 2]
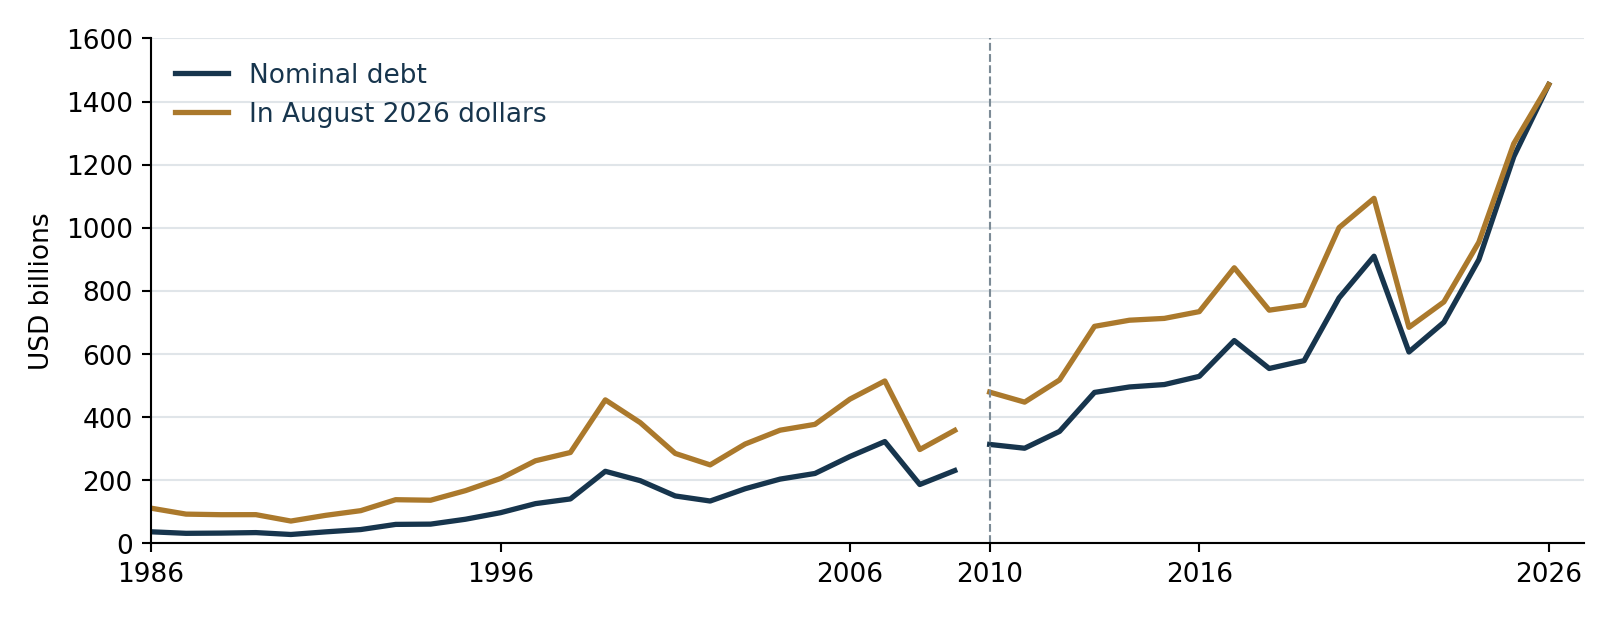
That expansion warrants scrutiny. It does not mean financial vulnerability has risen by 185%. Stock market values, collateral, investor wealth and inflation have also changed. To judge the increase in risk, we need to compare debt with the assets supporting it and assess borrowers’ liquid resources. Comparisons stretching back before February 2010 also cross a change in reporting coverage. [1]
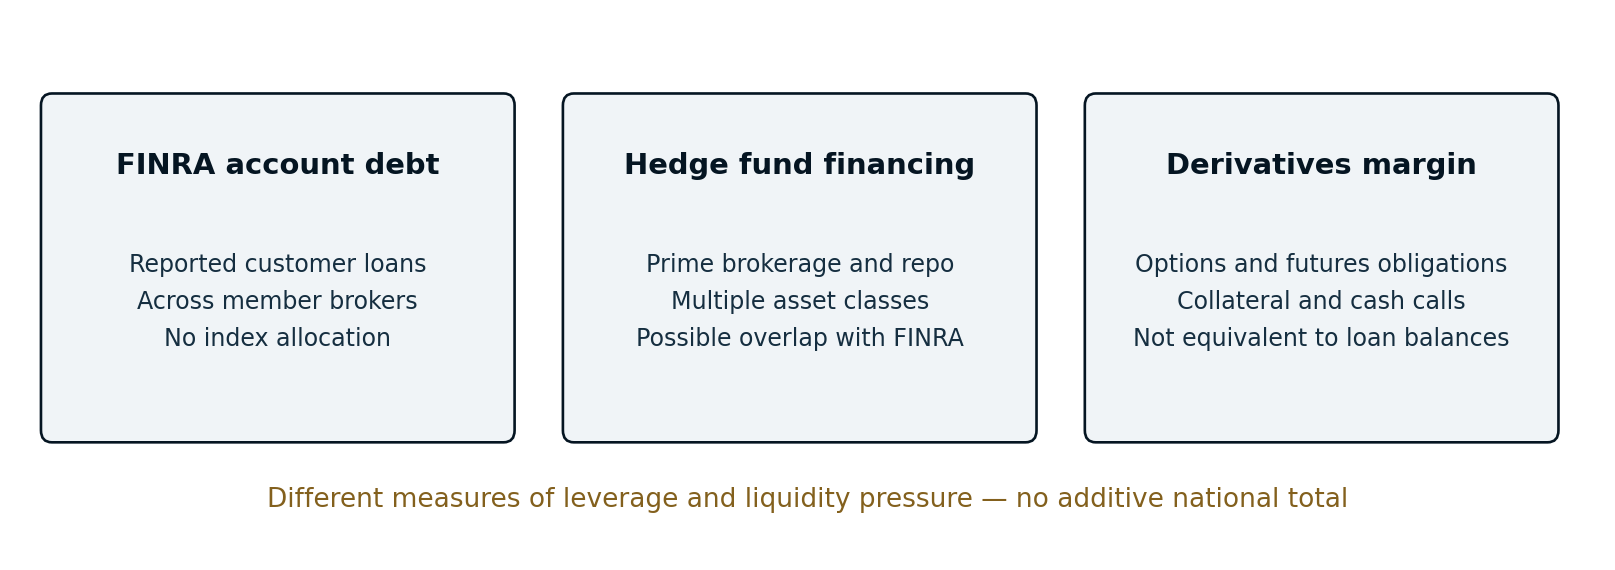
The wider financing picture includes hedge-fund borrowing and derivatives. Our workbook separates these categories because overlapping loans, different reporting populations and collateral deposits cannot be added into a reliable national borrowing total. An options margin deposit secures an obligation; it does not disclose how much money was borrowed to fund the position. [2]
Systemic exposure beyond FINRA
FINRA is one window into the financing system. It aggregates customer securities-account debt across its member brokers, including holdings traded on NYSE and Nasdaq markets. The missing exposure is not simply a list of other stock indexes: public reporting does not allocate these loans by index or isolate the borrowing behind particular options strategies. [1]
Our accompanying workbook records $7.952 trillion in secured borrowing by the qualifying hedge funds covered by OFR’s second-quarter 2026 data, including prime brokerage, repo and other secured financing. This is a broader reporting population across asset classes and domiciles, and may overlap FINRA debt. It cannot be added to FINRA’s $1.454 trillion to produce a clean U.S. investor-loan total. OFR identifies collateral declines, margin calls and dependence on short-term creditors as linked vulnerabilities. [2, 13]
Options and futures create another route for cash demands. Initial margin deposits secure obligations; variation margin and changing requirements can create further liquidity needs. Clearinghouse collateral figures show resources posted against risk, not the amount borrowed to fund positions. Derivatives can hedge a portfolio as well as increase its exposure, so neither contract notional nor collateral deposits should be treated as extra loan balances. The systemic concern is simultaneous cash demand across these channels. [2]
How the pressure can spread
The first stage is pressure on individual positions. A decline in collateral value can leave a borrower below the lender’s required equity cushion. Depending on the account and contract, the investor must contribute cash or eligible assets, reduce the position, or face liquidation. Higher margin requirements can intensify that pressure.
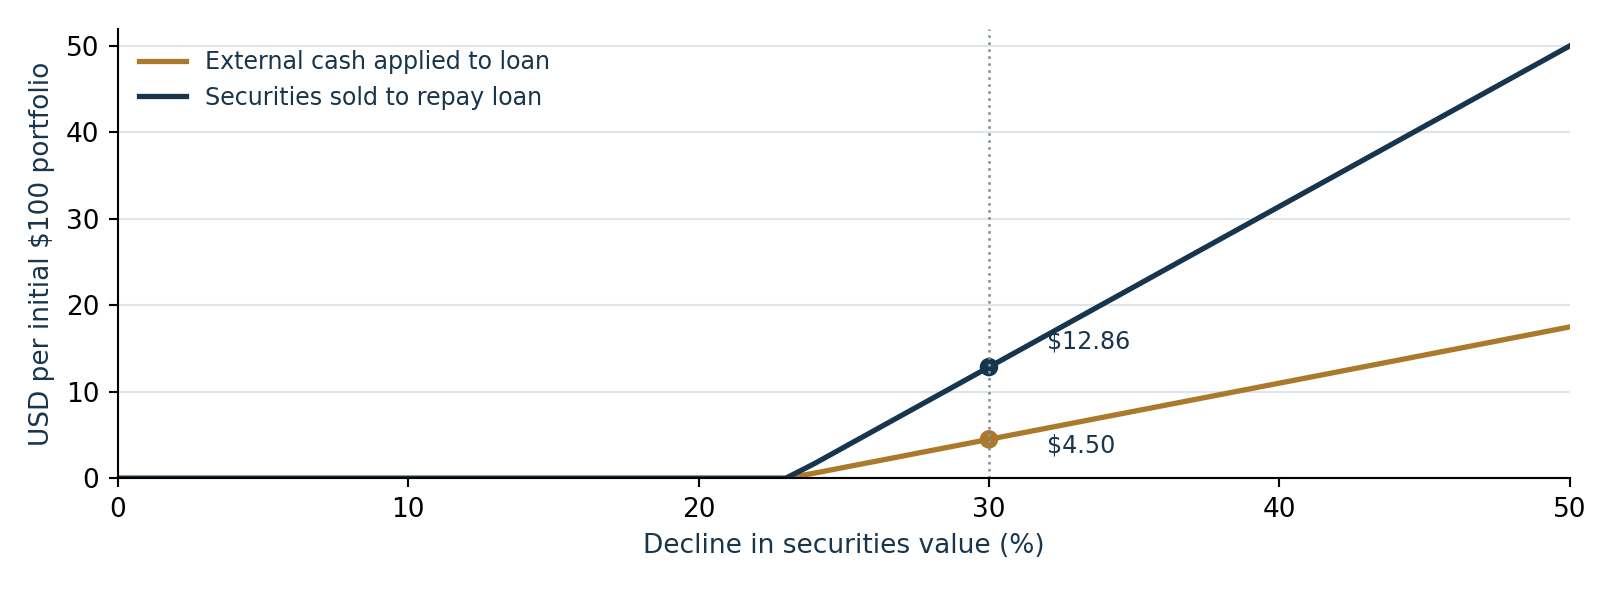
Consider a simplified account holding $100 of securities against a $50 loan. After a 30% price decline, its assets are worth $70 and its equity is $20, or 28.6% of asset value. If the lender requires 35% equity, it would need $4.50 of additional cash applied to the loan, or roughly $12.86 of securities sold with the proceeds applied to the loan. These are illustrative assumptions, not an estimate of current accounts or a universal margin rule.
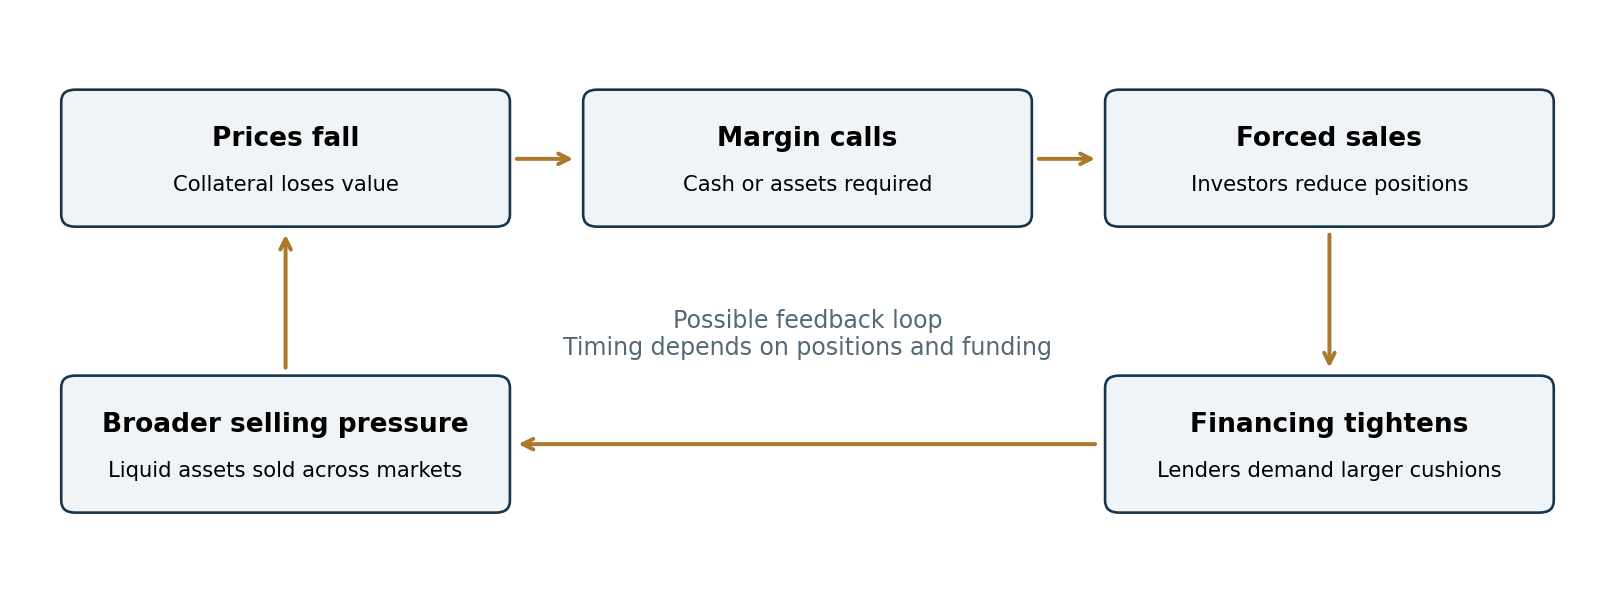
The second stage is selling across portfolios. Investors may sell readily traded assets to raise cash for a stressed position elsewhere. Major stocks and Treasuries can therefore come under pressure even when the original problem lies in another market. Investors who repay their loans through asset sales can still amplify a correction; default is not necessary.
The third stage is pressure on financing providers. If brokers and dealers restrict credit, demand larger collateral cushions, or reduce their willingness to absorb sales, other investors may have to cut positions. These stages can overlap. The outcome depends on concentration, hedges, financing terms and the depth of available buyers.
History shows both amplification and resilience
Recent history offers a useful comparison. The New York Fed describes the unwinding of leveraged Treasury cash–futures trades as a likely contributor to market disruption in March 2020. In April 2025, relatively stable repo funding and continued dealer intermediation helped prevent a comparable broad unwind of that trade. [3]
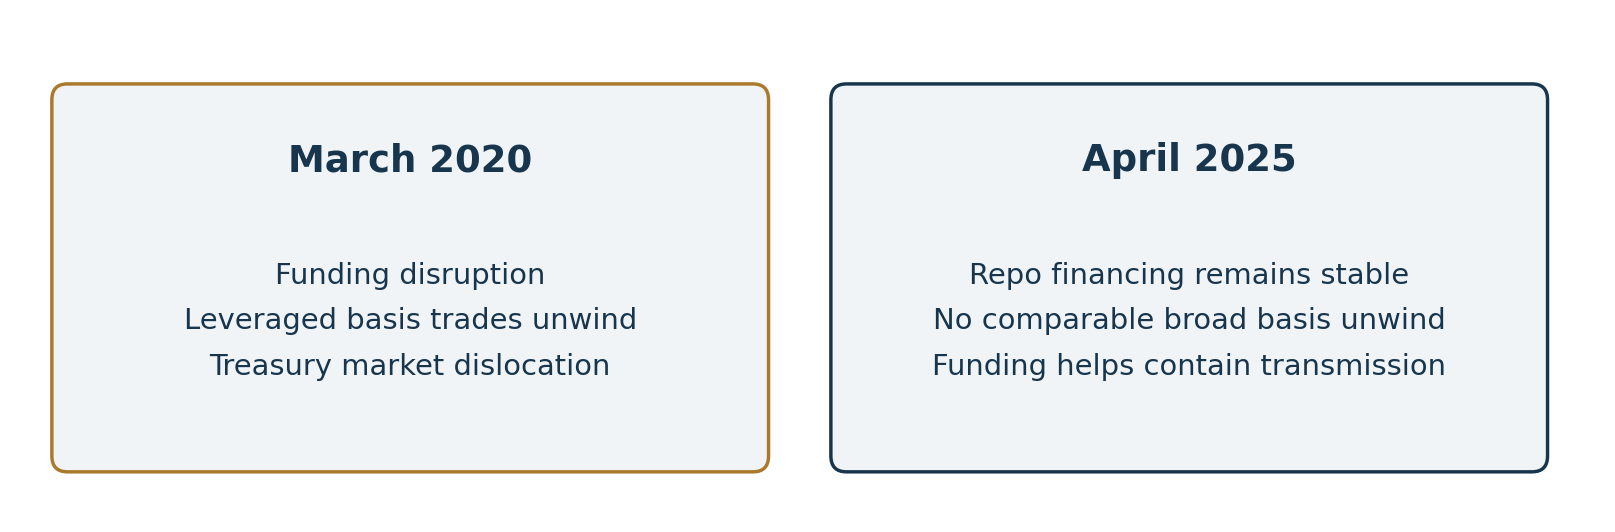
The April 2025 correction was substantial. The Federal Reserve reported that major stock indexes had fallen almost 20% from their February peaks by the second week of April. It identifies excessive leverage and liquidity mismatches as conditions that can produce self-reinforcing margin spirals. The episode nevertheless showed that a sharp decline need not become a systemic funding crisis. [4]
What the public data cannot answer
The sources assembled so far do not establish the percentage of U.S. securities purchases funded with borrowing, or the proportion of investors unable to meet calls under a particular shock. Outstanding debt is a balance at a point in time; purchases are transactions over a period. Dividing one by the other would not measure the share of purchases financed on margin. [1, 2]
A meaningful stress exercise would test market declines of different sizes alongside tighter collateral requirements, reduced financing and imperfect hedges. It would distinguish losses from cash demands, and cash demands from forced sales. Without account-level liquidity and position data, any systemwide result must be presented as a scenario with explicit assumptions.
Why this assessment is needed now
We are assessing leverage now because inflation, renewed monetary tightening, elevated bond yields and geopolitical uncertainty can affect both valuations and the cost of carrying debt. The concern is that these pressures could coincide with a market decline and expose borrowers’ dependence on continued financing.
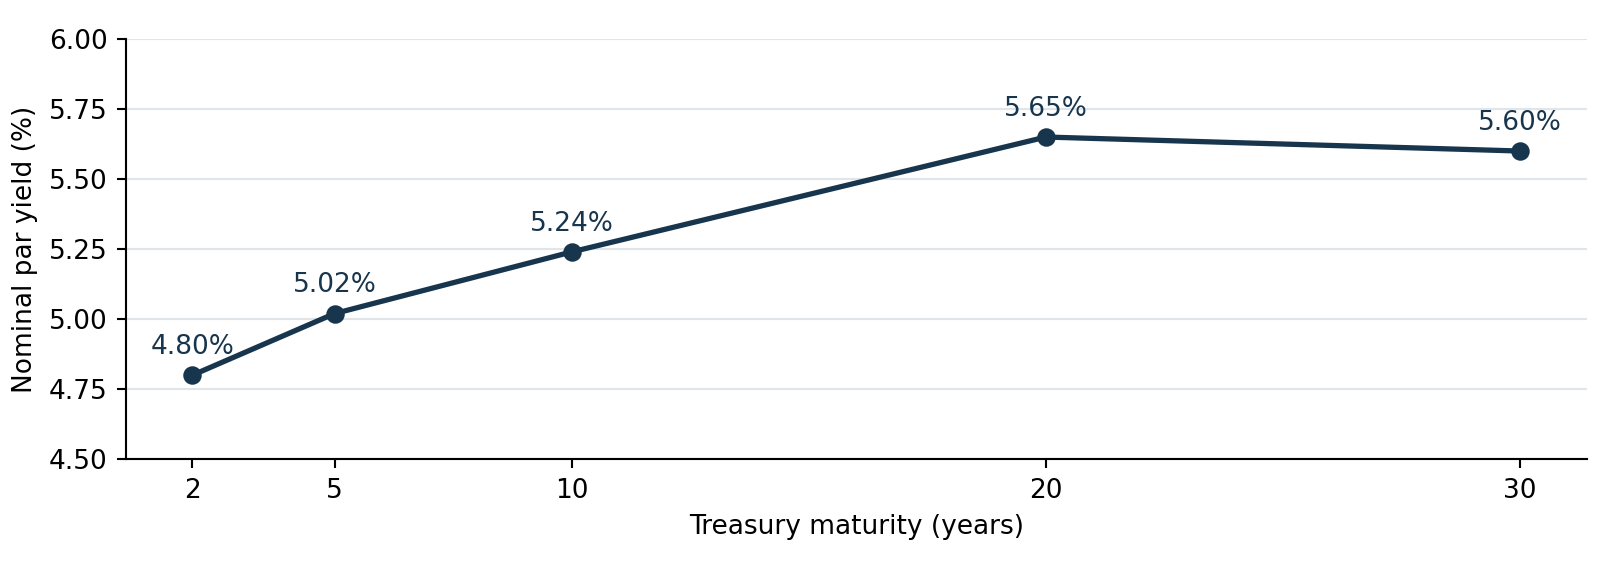
On September 16, the Fed raised its policy-rate target by 0.25 percentage point to 3.75–4.00%, citing elevated inflation. Treasury’s published October 9 curve put the 10-year yield at 5.24% and the 30-year at 5.60%. Higher yields can raise refinancing costs, reduce prices of existing fixed-rate bonds and increase the return investors demand from stocks. The yield curve is a financing backdrop, rather than a precise clock for a correction. [10, 11]
Tariffs and conflict add supply-side pressure. In his September 29 assessment, New York Fed President John Williams identified tariffs, Middle East supply-chain and energy disruptions, and AI-related demand as inflation drivers. He also said tariffs were no longer adding to goods inflation and that broader, persistent spillovers had not yet been demonstrated. Iran-related escalation remains a risk to energy supply and transport; the stress scenario is a prolonged disruption that keeps costs elevated while financing becomes less accommodating. We should distinguish this risk from a verified attribution of every price increase to the conflict. [12]
Federal debt adds a separate constraint. CBO’s February 2026 current-law baseline projects publicly held debt rising from 101% of GDP in 2026 to 120% in 2036, with rising net interest costs driving much of the projected increase in deficits. That is evidence of sustained fiscal pressure, rather than proof of an immediate debt spiral or Treasury default. Treasury liquidity also matters because leveraged investors use government securities in financing and trading strategies. [6]
The current indicators are mixed. August CPI rose 3.4% over the preceding year. September unemployment was 4.2% and changed little, while second-quarter nonfarm business productivity increased 1.4% at an annualized rate and 2.2% from a year earlier. These observations support examining inflation and financing pressure, but they do not show that every economic indicator signals an impending correction. September CPI is scheduled for October 14 and is not yet available as of this draft. [7, 8, 9]
These pressures justify examining how a correction could unfold; the evidence does not show that every indicator points in the same direction. The Fed describes solid activity, robust investment and little change in unemployment. Our study tests the adverse combination of risks against that resilience. The 185% increase measures outstanding margin debt, not the share or growth of stock purchases financed with loans. [10]
Policy support has limits
Treasury buybacks serve cash-management and market-liquidity objectives. They should not be presented as proof that Treasury is preventing default or guaranteeing stock valuations. Treasury’s stated program objectives also distinguish buybacks from Federal Reserve monetary policy. [5]
The indicators worth monitoring are debt relative to collateral and market value, financing costs, changes in collateral requirements, concentrated positions and declining market depth. Rising debt alone cannot tell us when a crisis will occur. It does make the system’s ability to raise cash without disruptive selling a more consequential question.
Conclusion
The reason for this assessment is the combination of greater reported borrowing and pressures that could make borrowing harder to sustain. Inflation and geopolitical supply disruptions can keep financing expensive. Elevated yields can challenge valuations and weaken bond collateral. If earnings or incomes then disappoint, margin calls may arrive when investors have less spare cash.
That combination could turn an ordinary correction into forced selling across portfolios. Its severity depends on leverage relative to collateral, liquid reserves, hedges, lender requirements and the willingness of dealers to continue financing positions. Neither the debt increase nor the current macroeconomic indicators proves that a crisis is imminent.
Investors and lenders should therefore test falling asset prices, sustained financing costs and tighter collateral requirements together. Identify the calls that can be paid from available cash, the positions that must be sold and the exposures shared across borrowers. Our conclusion is a case for preparation now: the larger borrowing balance raises the dollar stakes, and the overlapping risks make the ability to withstand a cash squeeze worth measuring before markets test it.
Sources and methodology
[1] FINRA, Margin Statistics, accessed October 13 2026. August 2026 balance and reporting definitions. https://www.finra.org/rules-guidance/key-topics/margin-accounts/margin-statistics
[2] SP500_Profitability_Review.xlsx, version 3, October 13 2026. Borrowing and collateral tab. Historical figures and calculations are taken from the reviewed workbook; earlier decades require attention to its coverage notes.
[3] Federal Reserve Bank of New York, Recent Developments in Treasury Market Liquidity and Funding Conditions, May 9 2025. https://www.newyorkfed.org/newsevents/speeches/2025/per250509
[4] Federal Reserve, Governor Lisa D. Cook, Financial Stability, May 23 2025. https://www.federalreserve.gov/newsevents/speech/cook20250523a.htm
[5] TreasuryDirect, FAQs about Treasury Securities Buybacks, accessed October 13 2026. https://treasurydirect.gov/help-center/faqs/buyback-faqs/
[6] Congressional Budget Office, The Budget and Economic Outlook 2026 to 2036, February 11 2026. Current-law projections, not realized outcomes. https://www.cbo.gov/publication/61882
[7] BLS, Consumer Price Index August 2026, September 11 2026. https://www.bls.gov/news.release/cpi.nr0.htm
[8] BLS, Employment Situation September 2026, October 2 2026. https://www.bls.gov/news.release/archives/empsit_10022026.htm
[9] BLS, Productivity and Costs Second Quarter 2026 Revised, September 3 2026. https://www.bls.gov/news.release/prod2.nr0.htm
[10] Federal Reserve, FOMC statement, September 16 2026. https://www.federalreserve.gov/newsevents/pressreleases/monetary20260916a.htm
[11] U.S. Treasury, Daily Treasury Par Yield Curve Rates, October 9 2026. https://home.treasury.gov/resource-center/data-chart-center/interest-rates/TextView?type=daily_treasury_yield_curve&field_tdr_date_value_month=202610
[12] Federal Reserve Bank of New York, John C. Williams, Unwavering Dedication, September 29 2026. Speaker’s assessment and outlook. https://www.newyorkfed.org/newsevents/speeches/2026/wil260929
[13] Office of Financial Research, Hedge Fund Monitor, Borrowing by type and SEC Form PF methodology. https://www.financialresearch.gov/hedge-fund-monitor/categories/leverage/chart-23/
Detailed borrowing and dollar history